
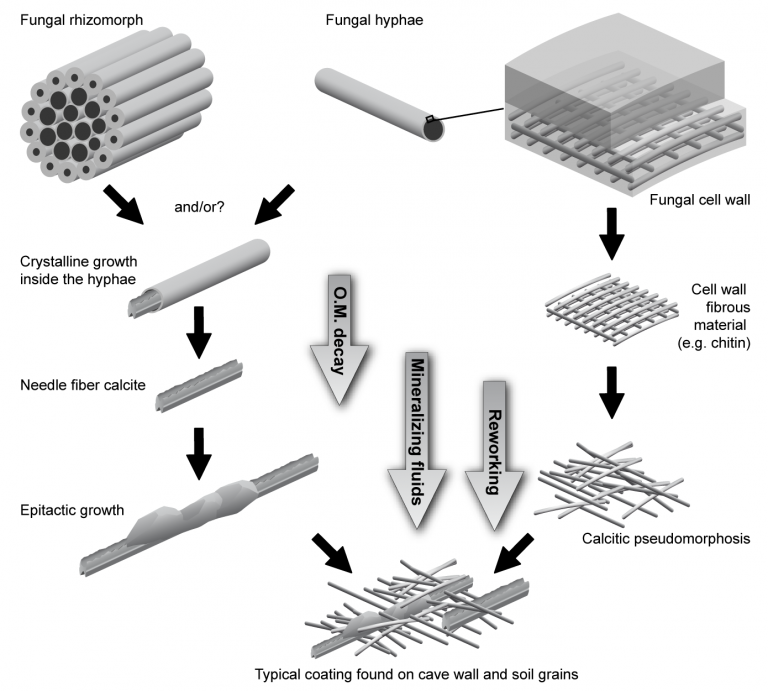
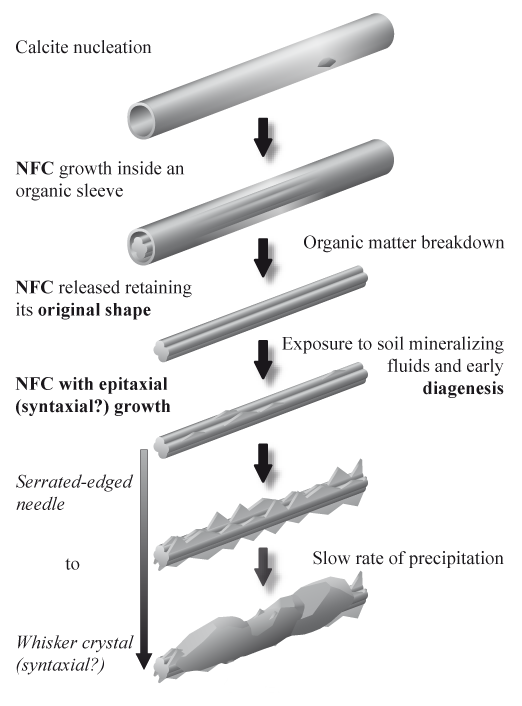
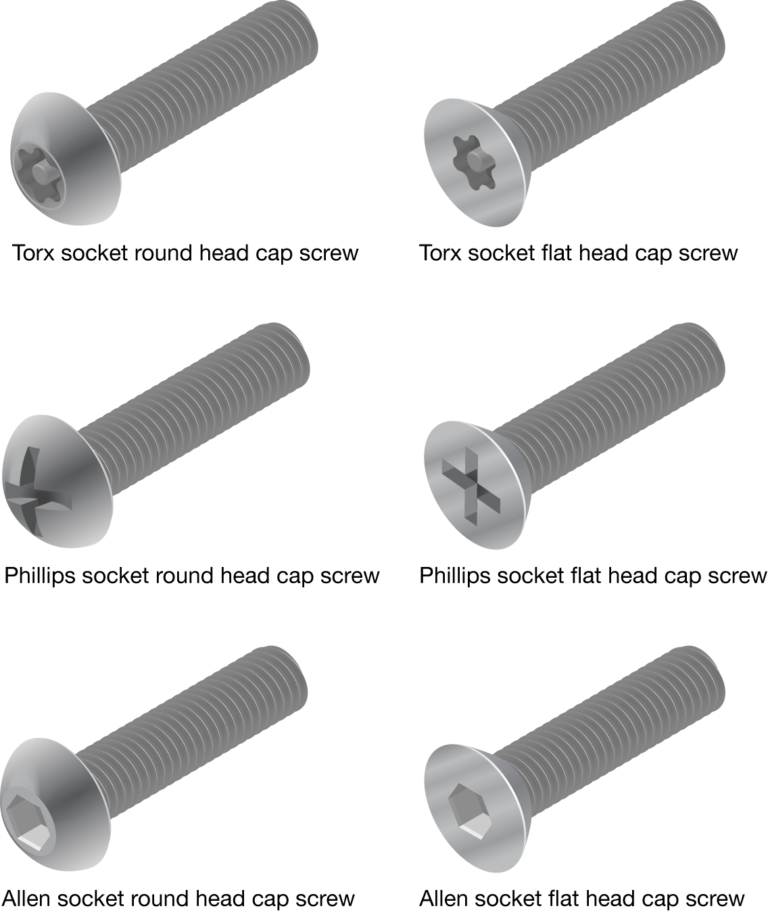
Scientific Illustrations
The illustration is not your stuff? You lack the time to dedicate yourselves to it?
We can help you with affordable prices for the quality of our products, as well as a fast and custom-made service.
I put my long experience in this domain to your service.


DataPartner is also present on Instagram.

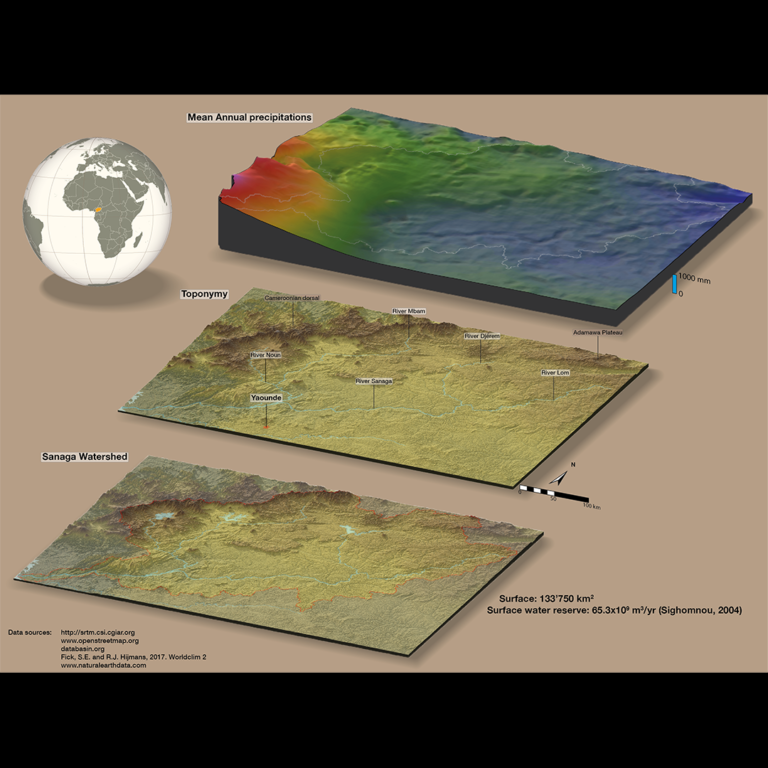
Interactive Maps
You want better insight from your data? We can help you!
For instance, we recently created a tailor-made interactive map for sales representatives from a medium-sized french enterprise to help them to follow-up the evolution of their sales. Updated from their Database an a daily basis it allows also to keep track of the evolution along the weeks with successive
backups. Based on open source technologies, this approach insures long-term stability with low costs of production and maintenance.The exemple above was produced with R for data treatment (inputs for the map) and Leaflet.js (for the interactive map display).
The map include 2-levels of interactivity, with a fast zoom-in/zoom-out with clickable polygons and home button to move quickly in the map, and tooltip and popup layers to get the best of their data.
Where were you (all) during your visit to this site?
Density Map based on IPs geolocation. Last update: 2019-06-13.