During my academic background, in my early years at university, I was taught how form and content are two cornerstones of communication. If the content is intrinsically the everyday thinking of a researcher, for the form, this is another story. The form depends on both how you structure your storytelling but also the quality of your visual support. In the worst case, no attention is paid to visuals. But sometimes, it is either the lack of time (or a choice where to spend it – this is particularly true during a tenure track position) or the lack of skills which lead to set aside this fundamental aspect of communication.
Whatever how good are your results, if they are not well presented, in the best case your audience will struggle to follow you and you will be remembered as a good scientist but as a bad communicator, in the worst case, you will not be remembered! To be a successfull scientist your science is not all! You need to also be acknowledged as a good communicator to build your network! A first impression is a fundamental driver of relationships.
As I said, the form is not only how your lecture, keynote is structured, this is also a matter of support, of visuals. I do not speak about mere scatterplots and other data visualizations, but more about synthetic drawings. Complex ideas are often hard to make understand by your audience, i.e. students, colleagues or a wider audience, but a picture says a thousand words, do not forget this proverb.
Why could you contact us?
If you make the choice to improve your infographic skills and so your communication skills, you need some prerequesites:
- you need good tools (vector graphics and raster graphics editors).
- you need time to practice (the learning curve can be steep, depending of your learning abilities).
- you need to ask yourself, do I have an artistic vision? Do I like to draw?
This latter is the most important point. I taught how to make computer graphics and slideshows to students and even more advanced researchers. For computer graphics, I taught to these audiences the technical aspects of vector graphics and raster graphics editors. But at the end of lectures, I emphasised the fact that tools are not all and that their imagination was the only limiting factor to do outstanding visuals. Unfortunately, imagination is not something that can be taught!
We have more than 20 years of background doing computer graphics for a wide variety of purposes like manuscripts, conference’s posters and presentations, lectures, public events, publications, book illustrations, and grant applications. Why would you outsource your scientific illustrations to us? To increase your productivity. I know this is a weird word for academics but when you are under pressure, when you think your time could be used in a better way, when you think your visual supports should be better, think DataPartner. DataPartner offers a state-of-the-art scientific illustration support(*). We know all the requirements related to scientists’ needs as our workflow was honed by our academic years.
How it works?
When you contact us, we provide estimates based on your needs. The more accurate is the formulation of your needs, the lower is the estimate. We can fit into tight project’s constraint or propose our own vision/concept of a theme for you. The final rendering is adapted to the use of the visuals and to your budget. After providing an advanced draft, modifications are made following your expectations. The final results are provided as svg files and images.
Delivery deadlines are adapted to your needs. We can work in tight time constraint, but in general the vector graphics are provided as fast as possible depending on our workload.
(*) though we are open to other type of illustrations, please contact us for more information.
You can follow us on instagram
You can find some of our published illustrations in the following publications:
- Deveau et al. (2018) Bacterial-fungal interactions: ecology, mechanisms and challenges. FEMS Microbiol Rev. link
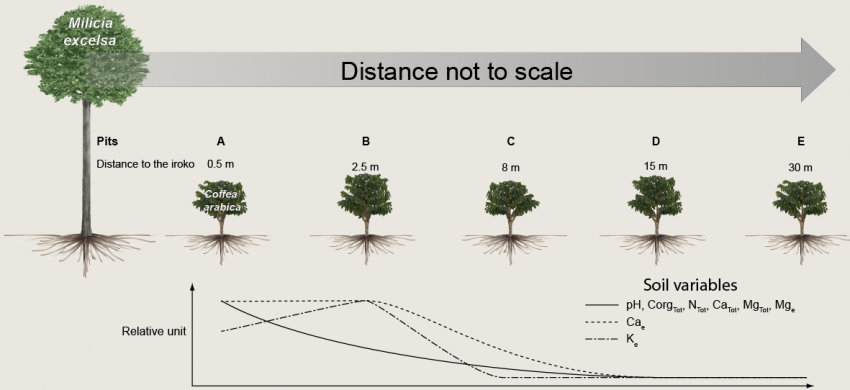
- Pons et al. (2018) Biocontrolled soil nutrient distribution under the influence
of an oxalogenic-oxalotrophic ecosystem. Plant and soil. link
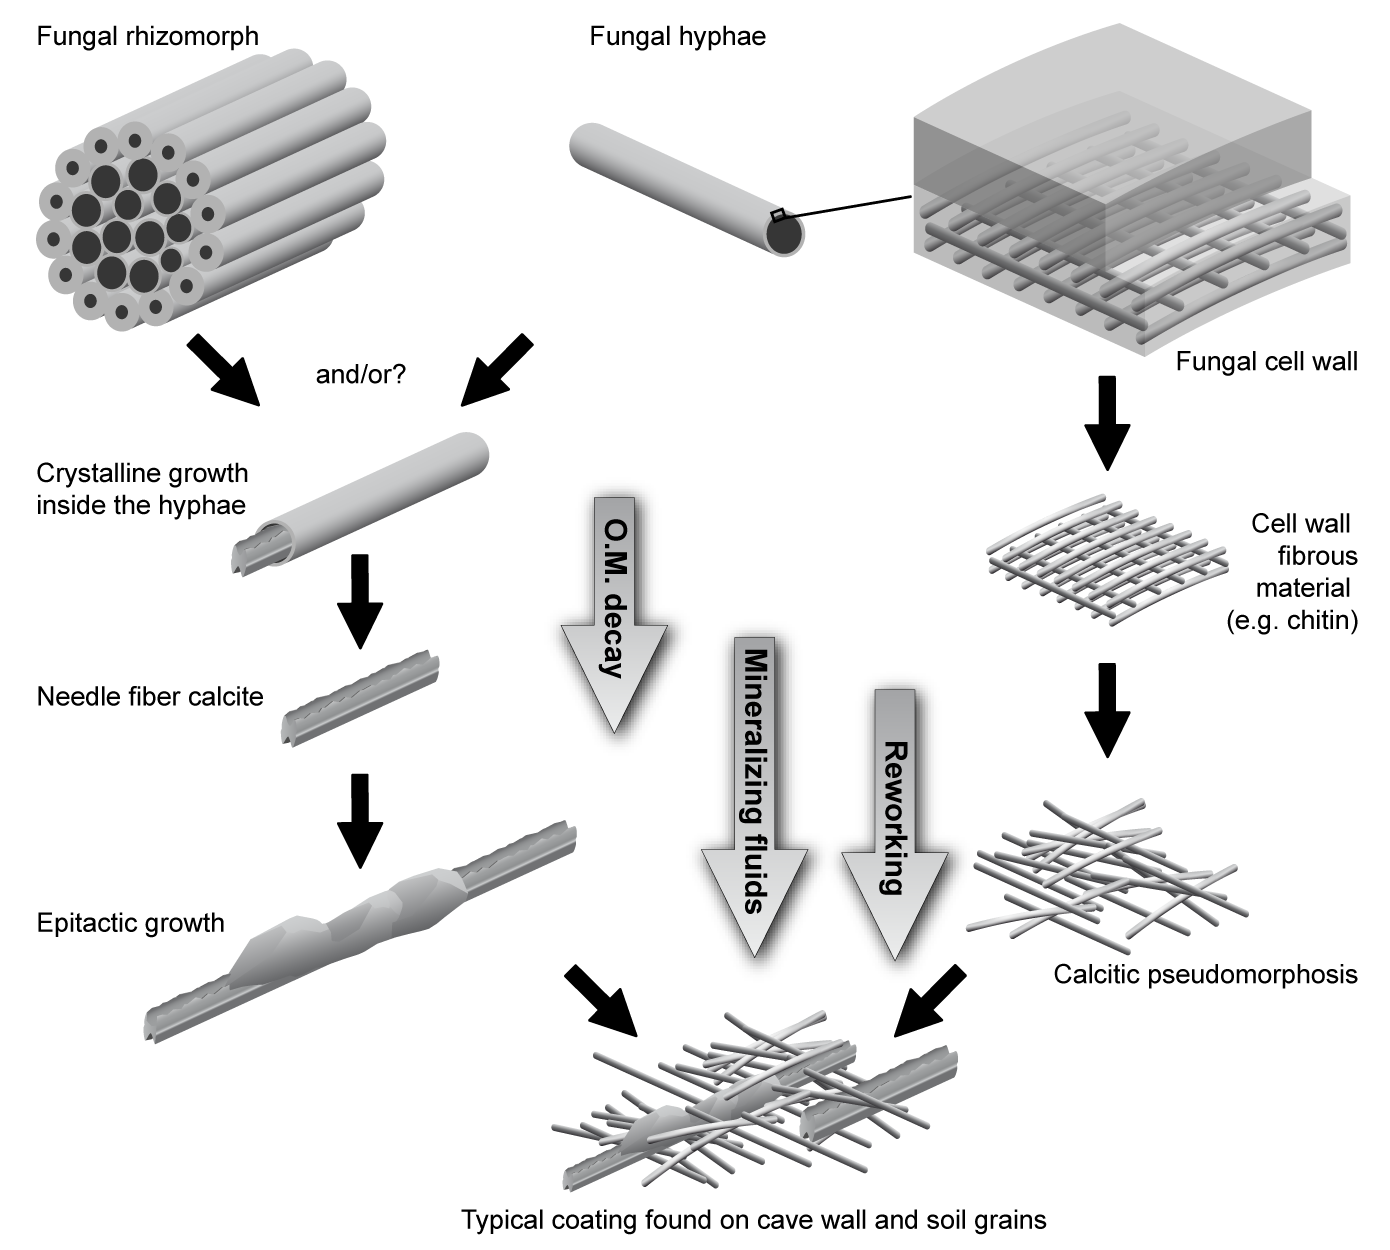
- Bindschedler et al., (2016) Role of Fungi in the Biomineralization of Calcite. Minerals, 6(2), 41.
- Cailleau et al., (2014) Detection of active oxalate-carbonate pathway ecosystems in the Amazon Basin: global implications of a natural potential C sink, Catena, 116, 132-141.
- Bindschedler et al., (2012) An ultrastructural approach to analogies between fungal structures and needle fibre calcite. Geomicrobiology Journal, 29, 4, 301-313.
- Martin et al., (2012) Fungi, bacteria and soil pH: the oxalate-carbonate pathway as a model for metabolic interaction, Env. Microbiology,14, 11, 2960-2970.
- Bindschedler et al., (2010) Calcitic nanofibers in soils and caves : a putative fungal contribution to carbonatogenesis. Geological Society, London, Special Publications 336, pp. 225-238
- Cailleau et al., (2009) The biogenic origin of needle fibre calcite. Sedimentology, 56, 1858-1875.

